Turning Your Data Into Insights You Can Use
Nearly 50% of organizations avoid or delay making updates to their applications, citing the hurdles associated with “designing an appropriate organizational structure to support data and analytics activities.”
What they don’t realize is that if they’ve implemented an M&E or reporting process, they’ve already done a lot of the heavy lifting.
Turning the data that they already have into actionable insights for their program could actually help them:
- find more efficient ways of allocating staff or resources
- spot opportunities for training (or re-training)
- discover ways to adjust eligibility requirements for their services to increase their impact
Avoiding this targeted exploration of your data can actually lead to more costly consequences than the effort to review it at all.
The consequences of setting and forgetting
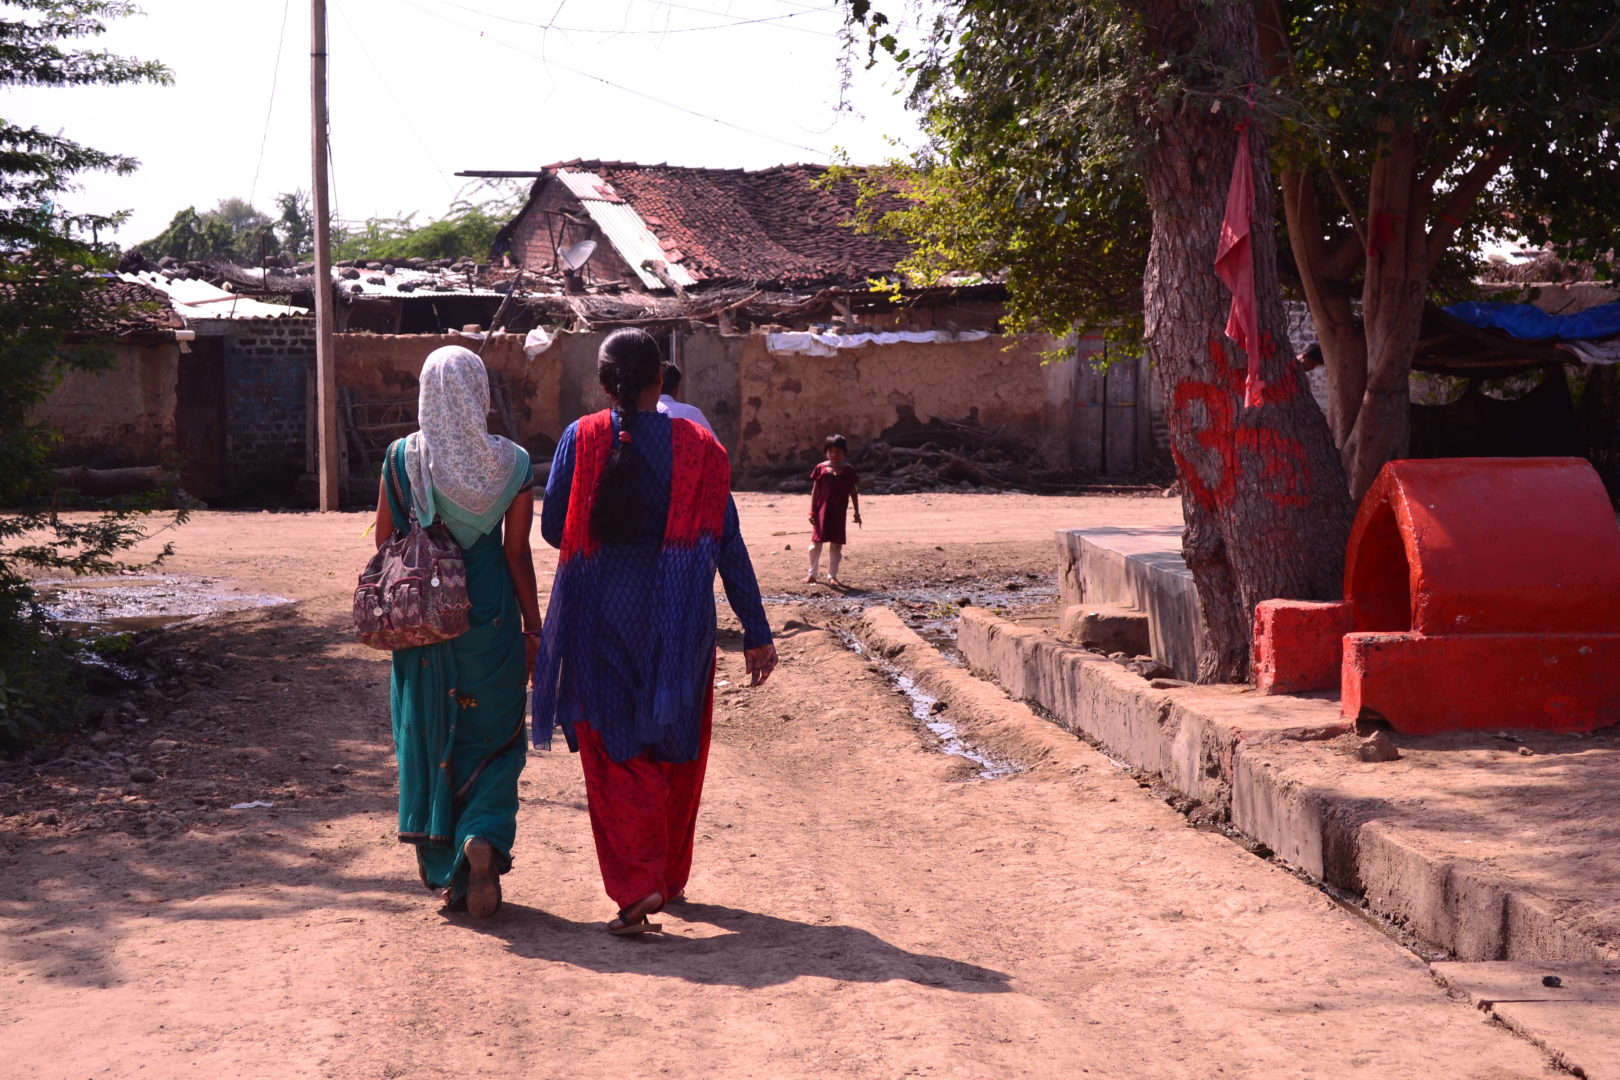
A few years ago, we worked with a community health organization in India. When they first ran their data analysis for end of quarter donor reports, they found that one entire catchment area had done almost no home visits. When they asked the field workers what had happened, they found that heavy rains meant no one had been able to walk to deliver at-home care. To restore coverage, the organization was forced to pay for thousands of dollars’ worth of alternative transportation (e.g., bike, auto fare, etc.) so their workers could continue home visits. Less service for more money.
Had this organization looked at that very same data more than once a month, they could have caught the issue earlier on and ensured that the people living in that catchment area wouldn’t have been overlooked for months.
Establishing a process of continual improvement
Actually establishing a process of continual improvement involves much of the same work it takes to set up your M&E and reporting processes. The real difference-maker is asking “why?”.
(1) Setting up meaningful data exports
Most organizations configure data exports to include all indicators needed for project milestone reporting and donor reporting. However, they often miss out on the opportunities to create data exports that show the day-to-day operating of their projects. By focusing only on high-level, endline data, organizations miss opportunities to distill important lessons from the data that comes into the system every day.
(2) Institutionalizing the regular review of your data
Oftentimes organizations think of their data exports as “set it and forget it.” Once they confirm that their data exports are working as expected, they only download and look at their data when it is time to do a monthly or quarterly report. Instead, staff should be continuously looking at the operational, day-to-day data for their projects. They should be on the lookout for anything that looks abnormal, so they can quickly investigate what may be occurring in the field.
(3) Establishing which data trends would trigger which actions
When setting up meaningful data exports, it’s important to understand what data trends would concern an organization, and what sort of action that would trigger. For example, if clinic visits are either up or down more than 20% in any given week, that might prompt the Project Office to follow up with the clinic head. Similarly if crop yields for an entire farmer cooperative are not showing up in the system, the Farmer Liaison could reach out to the Cooperative Leader to see why that data is missing.
(4) Understanding which programmatic changes are within the scope of the project
While it is always a good idea to better understand what is happening on the ground, projects should be honest about what actions they can realistically take based on incoming data. If clinic visits are up more than 20%, is there a way the project can reallocate medicine and protective equipment to the clinic? If not, will the clinic need to start cancelling appointments? If an entire farmer cooperative’s data is missing because their leader’s phone broke, will the project replace it? Or will a farmer liaison come and collect the data? Taking the time to plan what actions can and will be taken when certain data trends arise means that staff can act more quickly when they see a trend, and that they focus their efforts where they can have the most impact.
(5) Cultivate a culture of project flexibility, where changing the project midway through is celebrated
Oftentimes projects start with multi-year plans that are very rigid, with little ability to change mid-course. Project management staff should set the tone that changes can and will happen based on on-the-ground realities, and should encourage team members to speak up when they have an idea for improvement based on field-level data. Managers should also budget some small amount of money in anticipation of mid-course changes to programming.
Rapidly adapting to the COVID-19 pandemic
In 2016, MiracleFeet commissioned Dimagi to create a mobile data collection app to track treatment and program data for clubfoot, a common, treatable birth defect that has been historically overlooked in many parts of the world but that affects more than 175,000 babies every year. More than 9.75 million people alive today were born with clubfoot and an estimated eight million never received treatment.
MiracleFeet’s mission is to increase access to proper treatment for children born with clubfoot in low- and middle-income countries through partnerships with local healthcare providers.
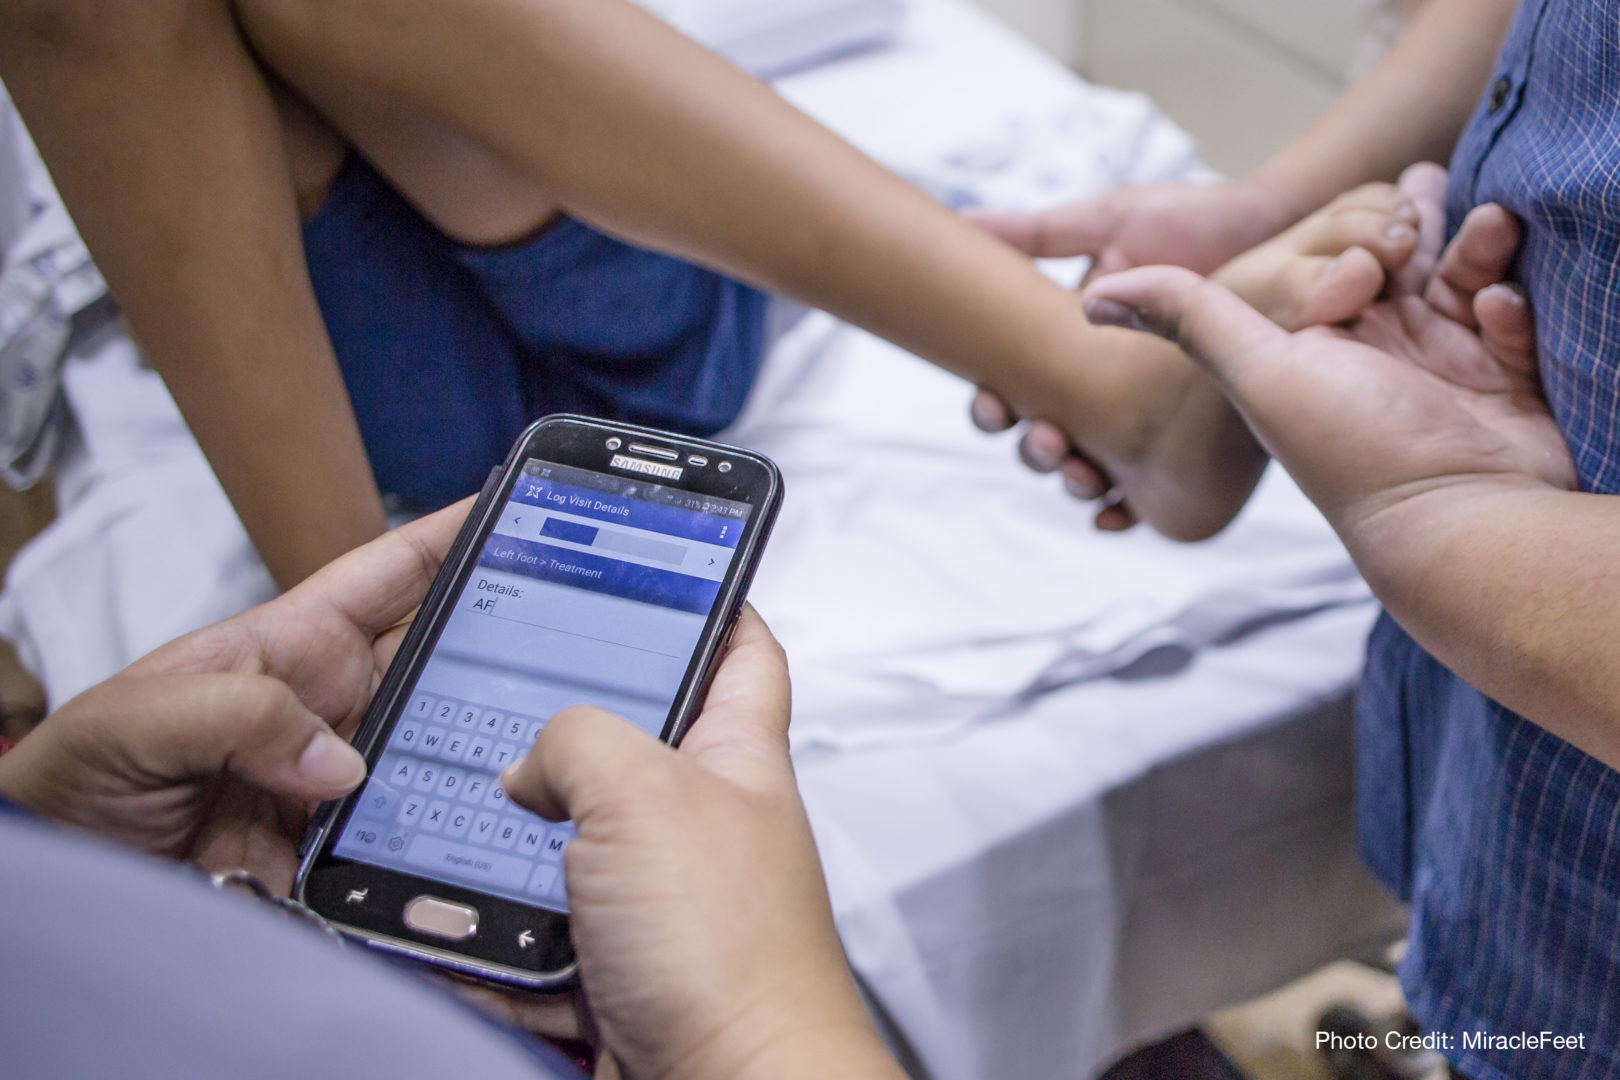
By the end of 2019, MiracleFeet completed the global rollout of the CommCare-based Clubfoot Administration SysTem (CAST) to nearly 300 clinics worldwide. So, as COVID-19 began to spread, MiracleFeet already had real-time data that revealed patterns of which countries—and which clinics—were slowing down and which were completely suspending treatment. This information allowed them to tailor their response and support strategy for each clinic’s program.
Their detailed information about clinics in Tanzania, for instance, showed that most were not shutting down, so they quickly reallocated funds to provide clinic staff and families with PPE. In Guatemala, clinics were completely closed, so the team was able to shift focus to address the highest priority needs of the community: providing food and supplies to the most vulnerable patient families. Powered by robust data, MiracleFeet was also able to track patient volumes and growing patient backlogs at clinics around the globe and to work with partners on tools to reach families and strategies to support them.
MiracleFeet Co-Founder and CEO, Chesca Colloredo-Mansfeld, shared: “When MiracleFeet implemented CAST, there was no way to predict the various and unintended applications created by the pandemic. In the very first year of global use, CAST has been under trial by fire and has exceeded our expectations in the most trying circumstances.”
Had the team at MiracleFeet decided that, because of the obstacles caused by coronavirus, they could no longer offer support, thousands of families would have suffered. Instead, they not only ensured that treatment for clubfoot could continue, but they expanded their support.
CAST has proven to be critical as MiracleFeet continues to manage the rapid changes brought on by the pandemic.
How to learn more
In a recent webinar, our Customer Support Team walked through the process of turning the CommCare data you already have into actionable updates to improve your project.
This webinar covered tangible steps to improve your program based on existing data, and our partners at MiracleFeet joined to talk about how they used the data from CAST to understand how to reallocate PPE amongst their clinics and shift their regular programming to offer support to food-insecure families during COVID.
Share
Tags
Similar Articles
Dimagi to Exhibit and Host Advanced CommCare Training at ICT4D Conference 2024
Join Dimagi at ICT4D Conference 2024. Sign up for Advanced CommCare Training & engage in impactful discussions on digital development.
Staff Blog
February 22, 2024
CommCare Research Grant Awardee One Year Checkin: Move Up Global | Winner
Celebrate the one-year anniversary of the CommCare Grant for Frontline Research with insights from Move Up Global, the first-place winner, whose study in rural Rwanda focuses on non-biomedical parameters of neglected tropical diseases (NTDs) and malnutrition among school-aged children to improve diagnosis, management, and case surveillance through community health workers and schools.
Staff Blog
February 21, 2024
Design Thinking: Unleasing the Power of Empathy
Being mindful and aware of deep insights Applying creative thinking, discovering new sights Exploring the boundaries of realm of art With innovation and design, to create something from start Design thinking, this creative mission We open our minds, for a whole new vision Fostering our skills, to a wiser design Solving problems, more easily to
Staff Blog
January 25, 2024